Year in Review
How Skynamo customer family have stacked up in 2020
placed in 2020
completed
TOP 3

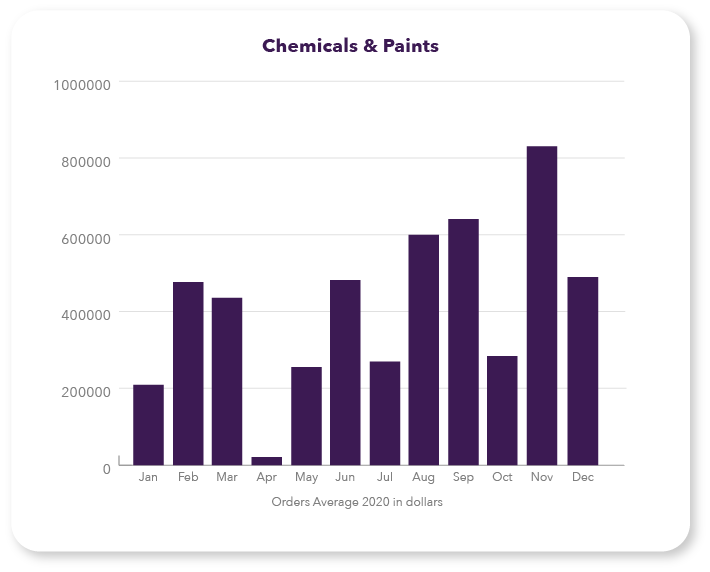
CHEMICALS
& PAINTS

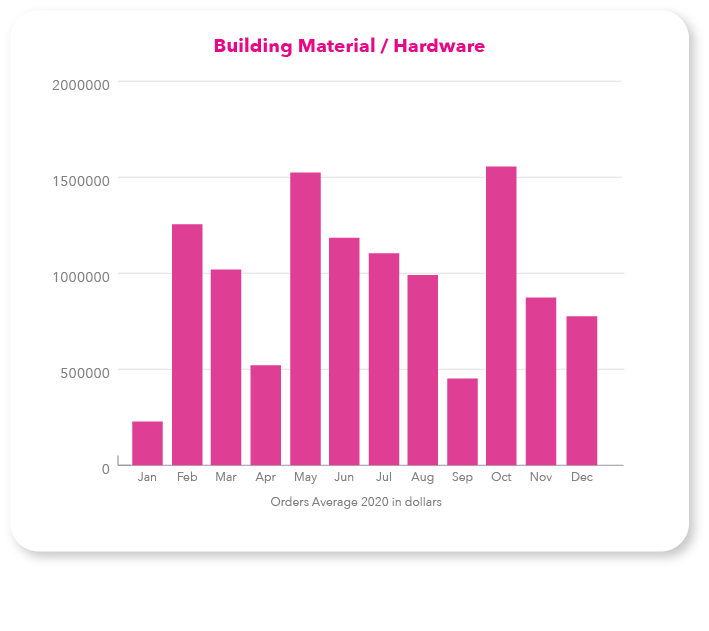
BUILDING MATERIALS
& HARDWARE

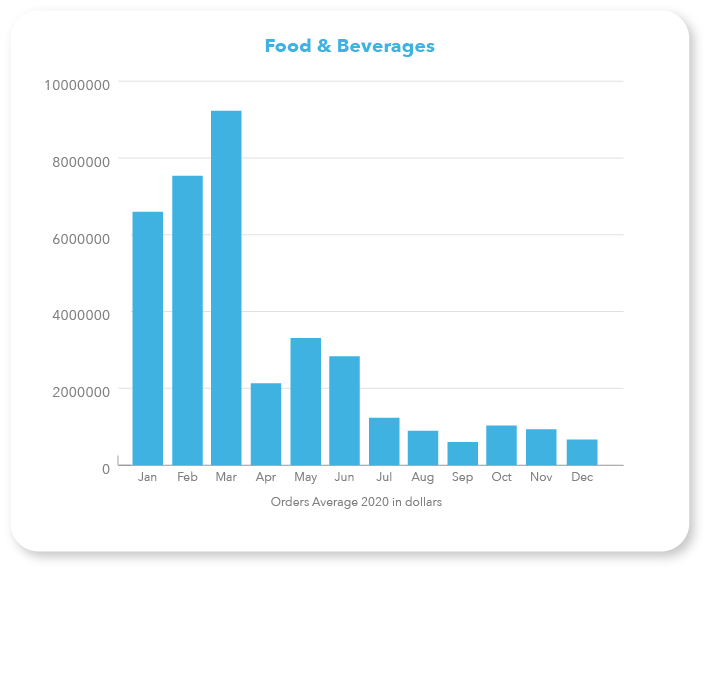
FOOD &
BEVERAGE
Highest performing industries
ORDER VALUE
JUN
With $15 976,50 in
average order total
ORDER ACTIVITY
NOV
Month with the most
order activity
TOTAL ORDERS
OCT
Month with the highest
number of total orders
Top 3 performing industries
based on total value of orders overall


2020 Order value average by industry in dollars
Order Average 2020 Quarterly View
From our perspective, a great way to look at the year that was, is to take a look at our Skynamo Customer Family Activity during 2020. Our success depends on our customers’ success, so our aim is to always be the sharpest tool in their shed.
The graph above shows the combined view of the order value average by industry, for all four quarters of the year. We see that quater-on-quater customers were proceeding with extreme caution from May until December by placing an increased number of low value orders regularly. This indicates understandable uncertainty and a careful approach to outlay risk through tricky times.
This was definitely a year like no other, which challenged Skynamo customers to proceed with extreme smarts. By using the data intelligence available from their Skynamo dashboards to make effective decisions, combined with the automation to stay connected with sales staff and customers efficiently, they have managed to maintain success despite the storms.
