We’re tracking the value of orders being captured by customers using Skynamo. Find your industry to see how you’ve fared during lockdown compared to Skynamo customers and if you’re experiencing the same level of recovery as they are.
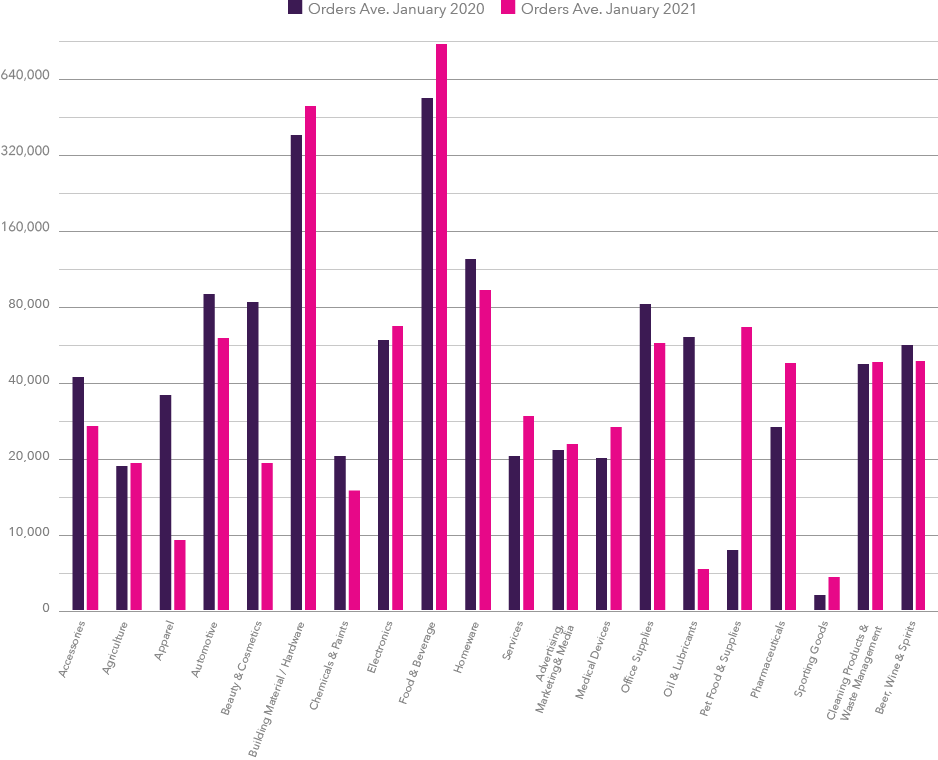
January 2020 vs January 2021
Order value average by industry
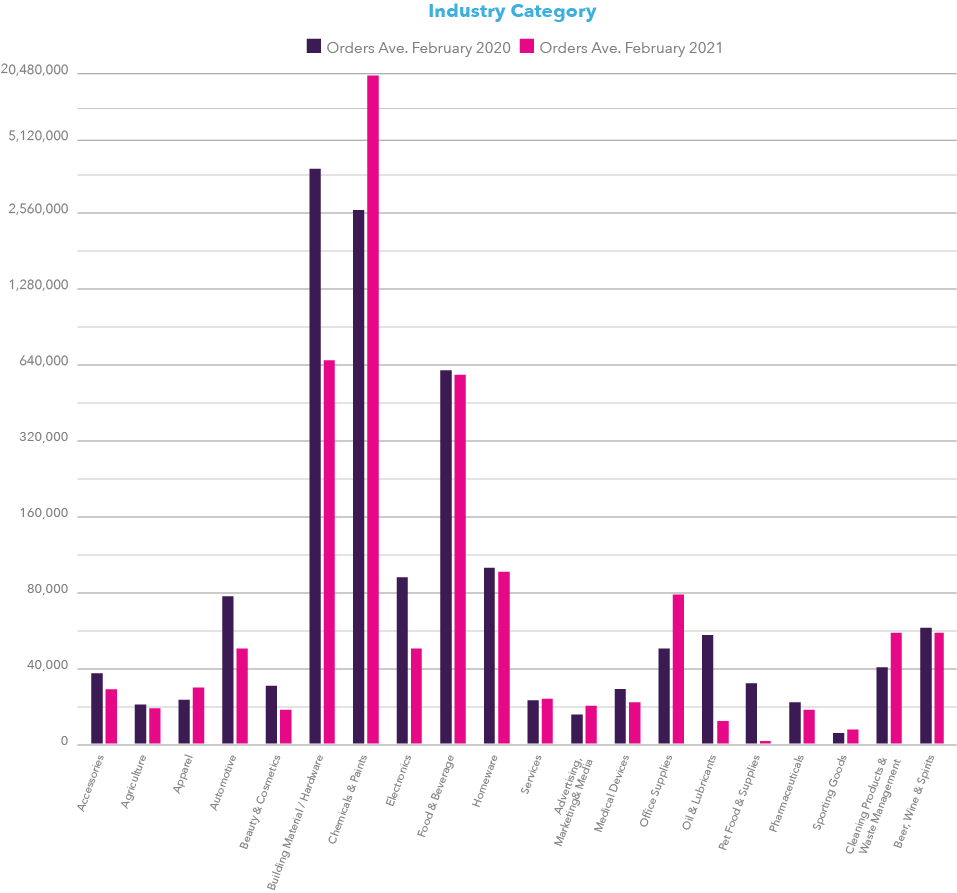
Industry Category
February 2020 vs February 2021
Order value average by industry
Industry Category
February 2020 vs February 2021
2021 has started with a pleasently surprising optomistic view toward order volumes where we see the majority of our Skynamo customer family placing high value orders in this first month, even exceeding last January before Covid had arrived. Overall the sentiment looks optimistic around ordering & investing in stock.
From a combined data view, comparing January 2021 against January 2020 we can see that although the number of orders placed in January 2020 was higher than January 2021 just gone, The average order value in monitary terms ishows a healthy almost a third higher in value size. This suggests that Skynamo customers are adapting and using the insights & information Skynamo provides to return to placing larger orders with comfidence.

Want to see hor you business is performing? Contact us for a demo of our Business Intelligence features.
See how your industry is doing
Jewellery
Eyewear
Watches
Hats
Handbags
Farming Equipment
Animal Feed
Landscaping Equipment
Seeds
Fashion
Business
Athletic wear / Sports clothing
Protective (PPE)
Auto parts
Tires
Machinery
Accessories
Cosmetics
Fragrances
Skin care
Hair Products
Beer and Cider
Spirits
Wine
All Alcohol Products
Construction
DIY and Retail Hardware
Industrial
Home
Business
Consumer
Beverages (Non-alcoholic)
Perishable Foods
Non-Perishable Foods
Imported / Exotic Foods
Confectionary and Baked Goods
Furniture
Appliances
Decorative
Medical Devices
Dental supplies and equipment
Office Supplies & Stationery
Hardware (Printers, Copiers)
Food
Accessories & Toys
Vitamins & Medicine
Financial Services
Cleaning Services
Gardening Services
Building Maintenance
Business Services and Consulting
Logistics
Accessories
What our customers have to say
Quick Stats
January 2021
placed in January 2021
ORDER ACTIVITY

Total number of orders
placed in January 2021
completed